Many, many entries like these in the log file, while my server remains visible but “Déconnecté” in the Network list:
2016-09-27T18:50:54+00:00 - info: Generating proof-of-work with 5 leading zeros followed by [0-9A-F]... (CPU usage set to 60%) for block#42329 9Hrc2f
2016-09-27T18:51:01+00:00 - info: Matched 3 zeros 00046C97EFA0CACEC954CB96ECB921DB2C5C3DC1D7682BFE7406254299842998 with Nonce = 400000000188 for block#42329 by 9Hrc2f
2016-09-27T18:51:01+00:00 - info: POST Peer BnSRjMjJ7g#42328
2016-09-27T18:51:05+00:00 - info: Proof-of-work interrupted for some unknown reason, restarting..
2016-09-27T18:51:05+00:00 - warn: Proof-of-work computation canceled
2016-09-27T18:51:05+00:00 - error: Proof-of-work computation canceled
Any way to find out what this “unknown reason” is? Any other server log files to be checked? And what to look for?
You are using a beta version, so some part of the code are still not very well tested.
This particular part is about the proof-of-work process which has been modified on this release to use all the CPU cores instead of just one core. That’s why you can see 5 processes: 1 for the main process, and 4 for the proof-of-work which sleep most of the time waiting for a proof-of-work to compute.
For your error, the easiest way is to search for your error message in the source code: I find it there:
I reverted to 0.30.17 which indeed does not suffer this issue. I’ll move up to the beta again once I’m ready for deeper debugging. For now, I’ve not even been able to get the current node fully functional. The server seems to be communicating (syncing, peering and posting pow) with others but never leaves Déconnecté status in the Network list in Sakia… The strange thing is that in Cesium it does appear under the green ones.
Anyway, a related question to this thread: I noticed you have a node of version 0.31.0a9 on raspi3.cgeek.fr … is that version not suffering the same issue?
About your “Disconnected” status in Sakia, this is pure network configuration issue. I am sure of this because your Raspi has found a proof as shown in http://remuniter.cgeek.fr.
Also, you should try the newest version 0.31.0 (no more a beta) on your Raspberry and see if you get the error again. Anyway, you should be able to reconfigure the network using either the UI (http://<your.raspi.ip:9220>) or directly the command line with:
My Raspberry PI 3 is now running 0.31.0, but I configured it with a random keyring, not my personal one: so it does try to compute new blocks, I cannot reproduce your problem here.
I’ve reconfigured the network settings many many times already, verified UPnP, set NAT port forwarding manually in my Neufbox to make sure… even set up a forwarding from port 8080 to the node’s local port (currently 15128) so I could use web-sniffer.net to see the node’s public response to /blockchain/current … all is looking good but still nothing.
Just upgraded but the same interruptions of pow are occurring… However, I do notice that sometimes the process seems to pass uninterrupted and post successfully. I don’t think I saw that with the beta before…
Is there a configuration option / parameter to reduce the number of processes used for pow? I tried upping powDelay (is that in seconds?) but that does not seem to prevent the process from restarting calculations immediately after interruption.
Ok I’ll do the same on mine if this cannot be figured out… The log file is growing too large too fast like this.
About your network issue, has it ever worked? Because I remember I’ve seen your node in green in Sakia today, for quite a long time. Maybe you just needed to relaunch Sakia.
The easiest way to see if your node is OK is to contact through a web browser, at the adress given in your logs.
I thing not that is exactly the problem. When I simply use the IP of my box (without :port_number), I land on the box admin even though I forwarded port 80 to my raspberrypi. While if I try with web-sniffer.net, I get the pi server response… Seems like the box only forwards external browser requests, so I suppose Sakia has the same problem and cannot access the node.
That would indeed confirm it. I never see my node as I’m on the same network while others can see it. And it also explains why cesium.duniter.fr does report my node in green… Pfff. Thanks for helping me figure this one out
Back to the POW computation cancellation issue:
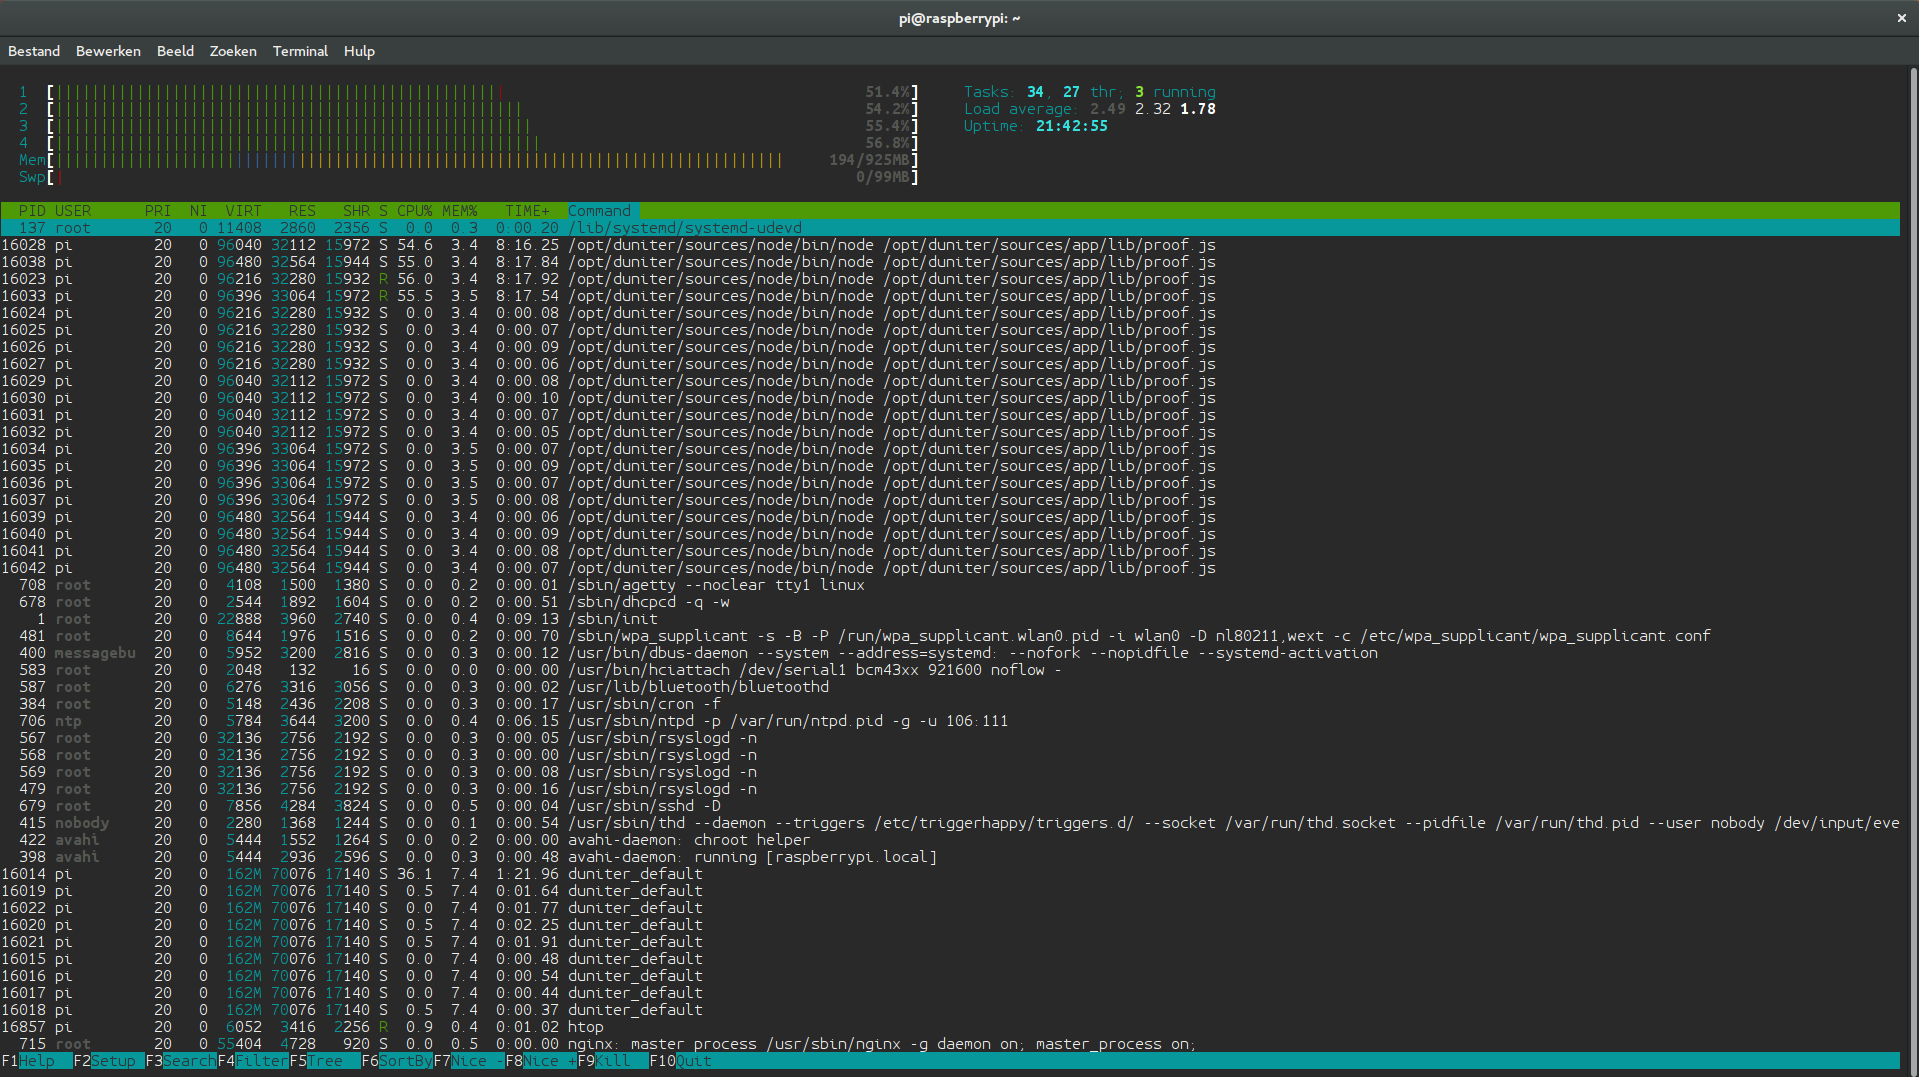
So there is no parameter to limit the number of processes? I tried reducing the cpu to 0.1 but that does not seem to work at all. CPU as reported by Htop is still at around 60% for all cores all the time (due to endless restarting of computation?) sometimes spiking to 100% on all cores.
One odd thing I notice is that htop reports 20 node/proof.js processes and 9 for duniter_default instead of the expected 4 node and 1 duniter process… See screen shot: