Voici un petit script pour obtenir des visualisations (un peu crado) sur l’historique des blocs calculés :
using HTTP, JSON, Pipe, Plots, Interact, Mux

# define url and query
url = "https://subsquid.gdev.coinduf.eu/graphql"
header = Dict("Content-Type" => "application/json")
query = """
query Query {
  blocks(orderBy: height_ASC) {
    validator
    height
    timestamp
  }
}
"""
body = Dict("operationName" => "Query",
  "query" => query,
  "variables" => Dict())

# get validators
validators = @pipe HTTP.post(url, header, JSON.json(body)) |>
  String(_.body) |>
  JSON.parse |>
  _["data"]["blocks"] |>
  getindex.(_, "validator")

# set of validator except genesis which is nothing
s = @pipe Set(validators) |> delete!(_, nothing)

# map validator to height
h = @pipe 1:length(s) |> zip(s, _) |> collect |> Dict

# plot it
x = 1:length(validators)-1
y = map(x->h[x], validators[2:end])
plot(x, y, linewidth=0, marker=:dot, size=(1900,1080), legend=false)
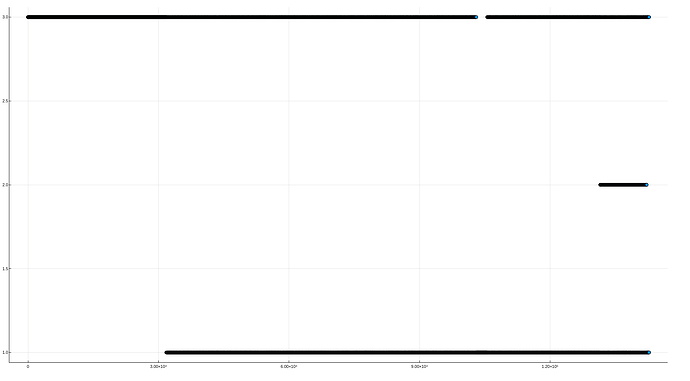
on voit ici :
3.les blocs calculés par cgeek
2.les blocs calculés par vit
1.les blocs calculés par moi
et on distingue bien les moments ou vit et moi rejoignons, et où cgeek fait une pause
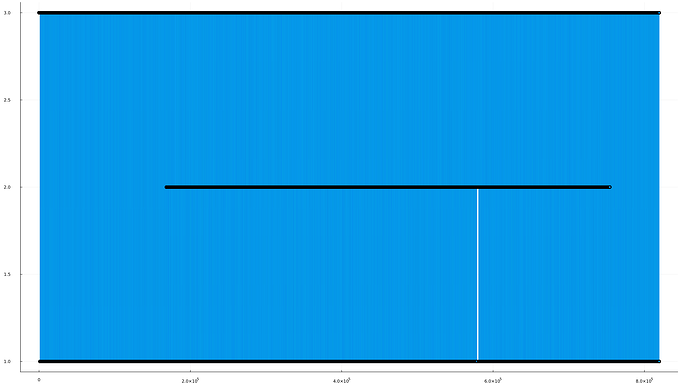
Comme ça fait beaucoup de points, on peut réduire et n’afficher qu’une fenêtre, en mode interactif :
plotlyjs()
w = 300 # width
b = 142000 # block
window = b:b+w # window
plot(x[window], y[window], linewidth=0, marker=:dot, size=(1900,1080), legend=false, ylims=(0,4))
ici on voit le bloc où vit arrête de calculer, 142207


