I’ve made some simulations and put the results in a LibreOffice Calc: Statisitcal_distance_simulations.ods (52.3 KB)
We can see the X% reached in the WoT for a given member, depending on d the average number of links per member and N the size of the WoT:
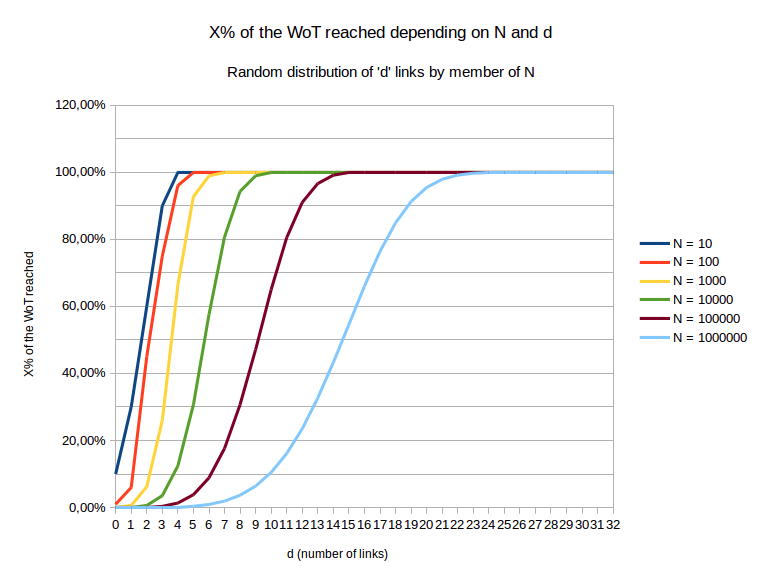
Few comments:
- the wider the N, the smoother the curve
- the distribution seems to follow a function we could try to guess or approach
So I’ve taken back my d_{min} = \exp{(\frac{\ln{(N)}}{k})} function, and see what simulation case it matches:
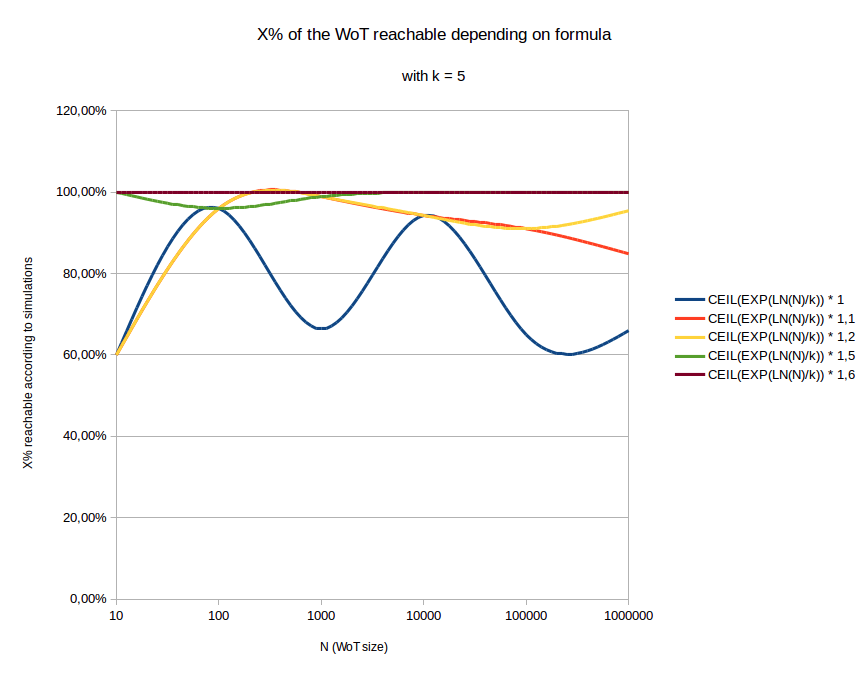
Comments:
- I am using a
CEILfunction to match my simulation results, which use discrete values d = 0..32 - original function (blue curve) is just enough to reach 60% of N. This was an expected result of my first message, because WoT is not a perfect tree.
- it seems that the perfect tree is contained within a WoT having certifications quantity \geq 1.6 \times d_{min}. This confirms my initial intuition of a perfect tree being contained within a WoT with double certifications count than perfect tree.
- we also have acceptable values to reach X%: p = 1.5 along with p = 1.2.
The lower p the better here: because this allow more members to be part of the distance rule by being sentries.
If I had to choose p value right now, I would choose p = 1.2.
But maybe we can find a better function than \exp{(\frac{\ln{(N)}}{k})}.
For now, I will develop uCoin based on this conclusions: we have to choose parameters for %X and p.